Coverage Zones
Coverage zones show areas that can be reached from each of multiple source points within a certain time or distance limit using a transport network.
They are built by calculating reachability per point, generating Voronoi polygons, and optionally clipping them to a boundary.
The library supports several methods for generating coverage zones:
Coverage using transport graph
Uses a full routing engine to determine reachable areas per point, then builds zones.
objectnat.get_graph_coverage(gdf_to, nx_graph, weight_type, weight_value_cutoff=None, zone=None)
¶Calculate coverage zones from source points through a graph network using Dijkstra's algorithm and Voronoi diagrams.
The function works by
- Finding nearest graph nodes for each input point
- Calculating all reachable nodes within cutoff distance using Dijkstra
- Creating Voronoi polygons around graph nodes
- Combining reachability information with Voronoi cells
- Clipping results to specified zone boundary
Parameters:
| Name | Type | Description | Default |
|---|---|---|---|
gdf_to
|
GeoDataFrame
|
Source points to which coverage is calculated. |
required |
nx_graph
|
Graph
|
NetworkX graph representing the transportation network. |
required |
weight_type
|
Literal['time_min', 'length_meter']
|
Edge attribute to use as weight for path calculations. |
required |
weight_value_cutoff
|
float
|
Maximum weight value for path calculations (e.g., max travel time/distance). |
None
|
zone
|
GeoDataFrame
|
Boundary polygon to clip the resulting coverage zones. If None, concave hull of reachable nodes will be used. |
None
|
Returns:
| Type | Description |
|---|---|
GeoDataFrame
|
GeoDataFrame with coverage zones polygons, each associated with its source point, returns in the same CRS as original gdf_from. |
Notes
- The graph must have a valid CRS attribute in its graph properties
- MultiGraph/MultiDiGraph inputs will be converted to simple Graph/DiGraph
Source code in src\objectnat\methods\coverage_zones\graph_coverage.py
12 13 14 15 16 17 18 19 20 21 22 23 24 25 26 27 28 29 30 31 32 33 34 35 36 37 38 39 40 41 42 43 44 45 46 47 48 49 50 51 52 53 54 55 56 57 58 59 60 61 62 63 64 65 66 67 68 69 70 71 72 73 74 75 76 77 78 79 80 81 82 83 84 85 86 87 88 89 90 91 92 93 94 95 96 97 98 | |
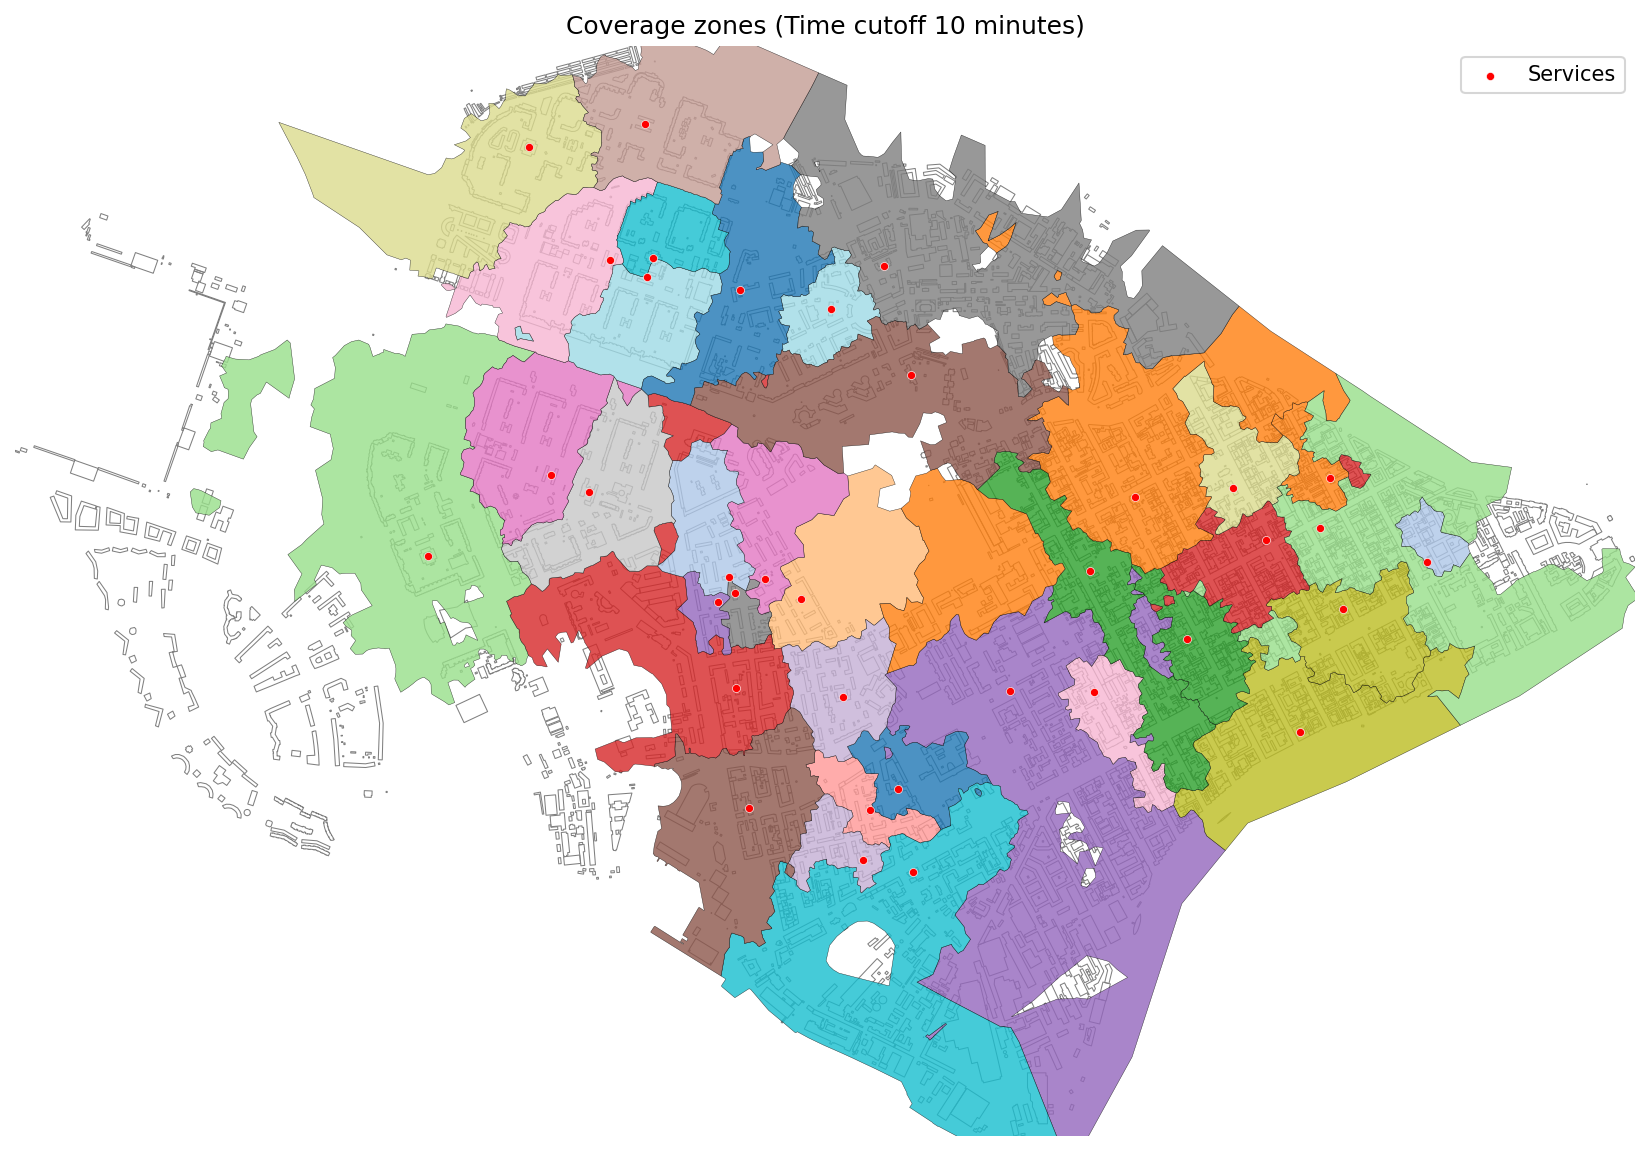
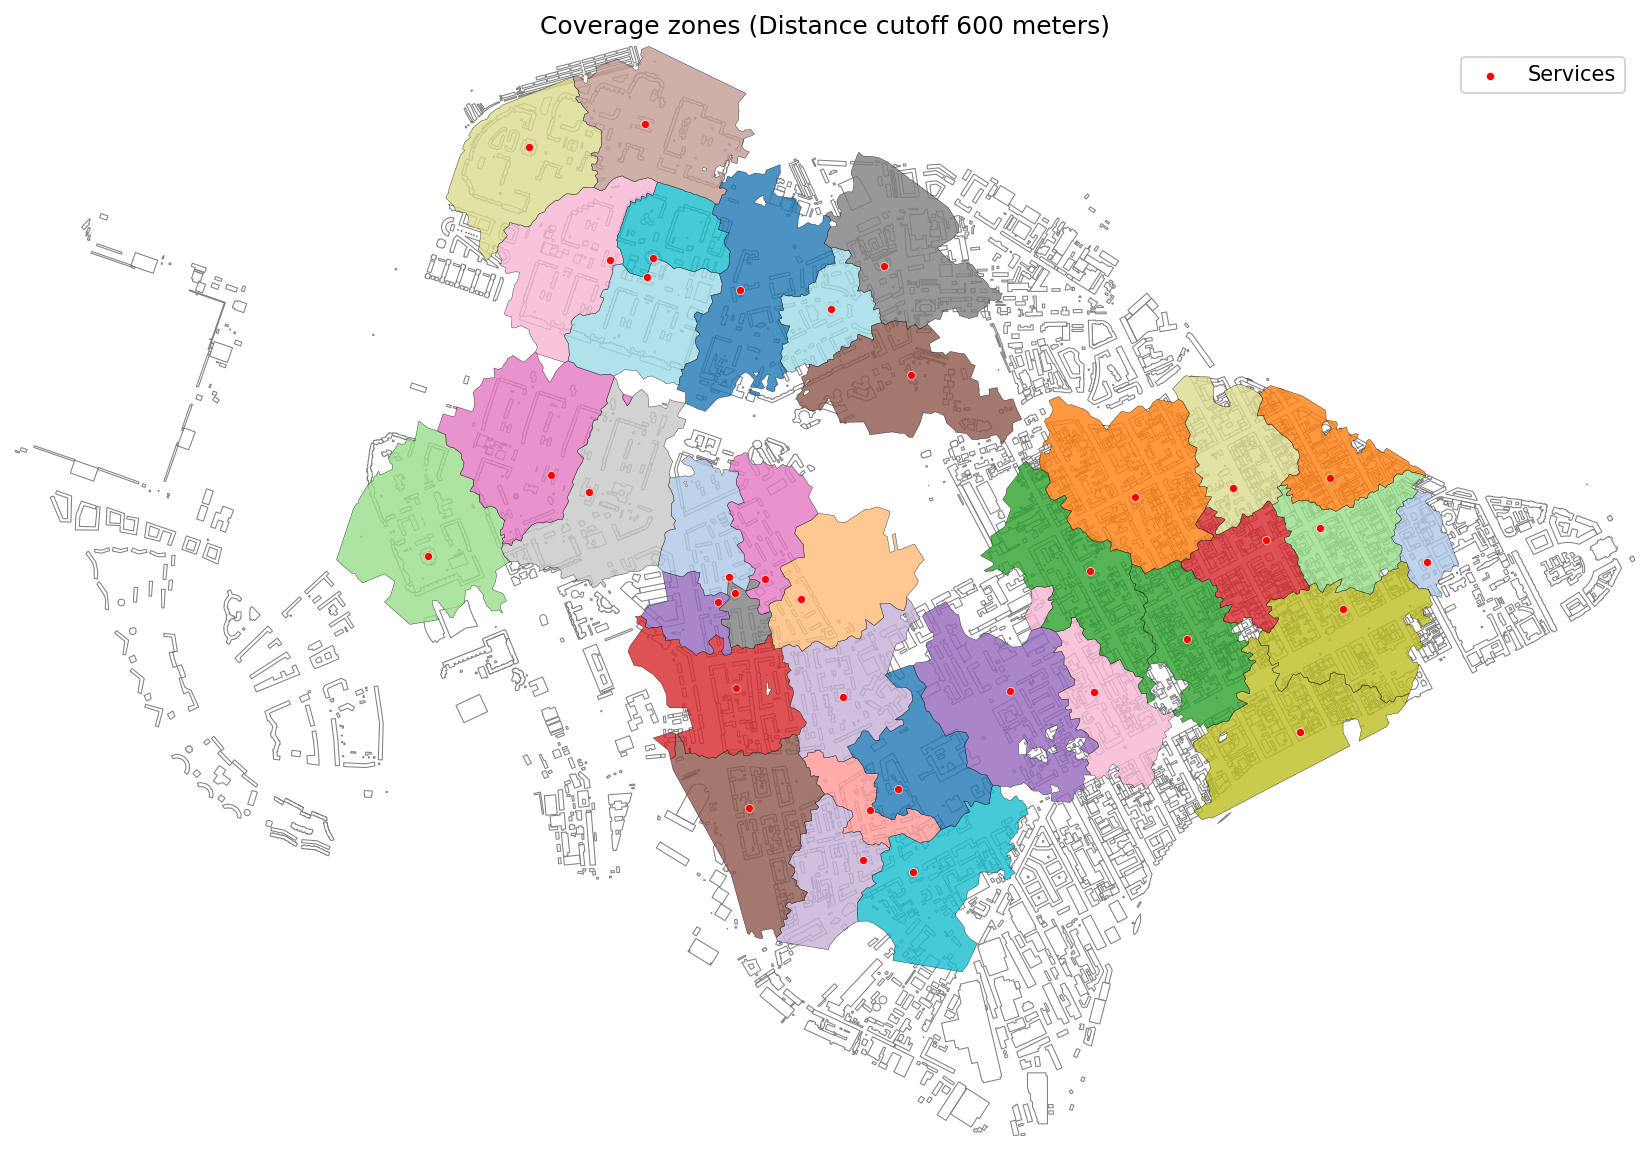
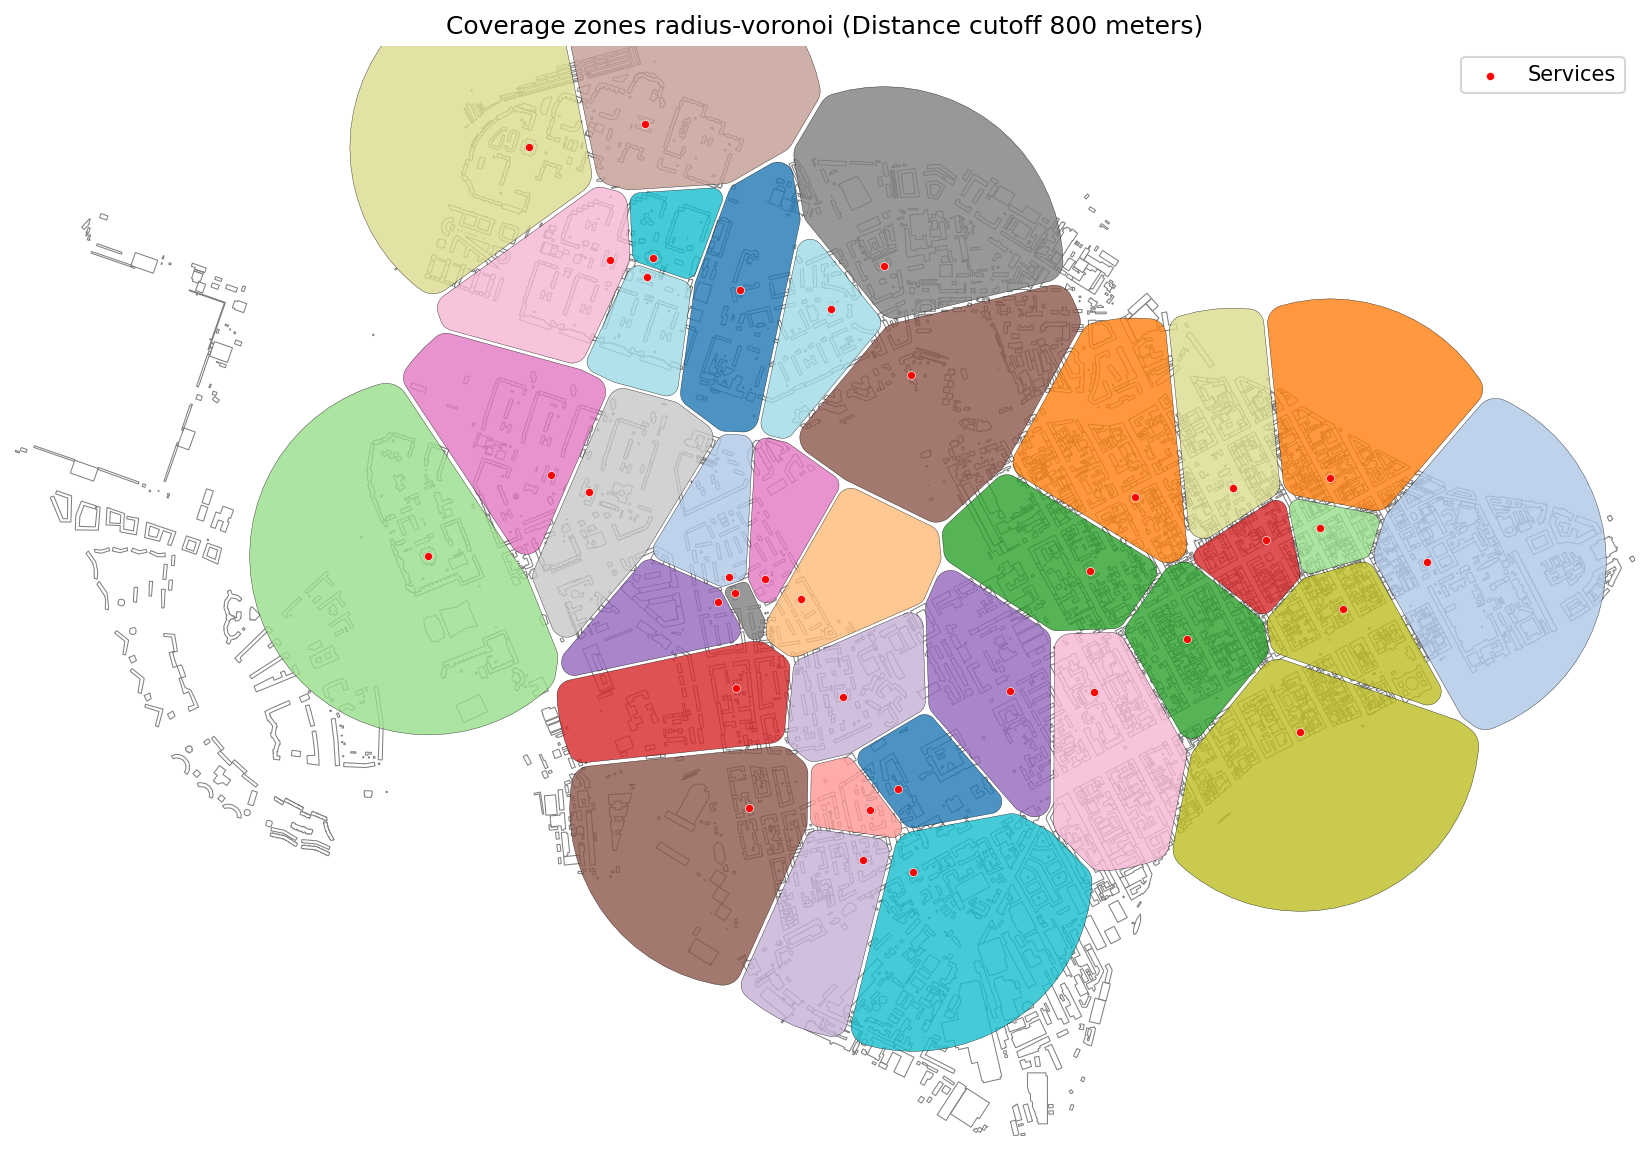
Coverage using radius only
Generates fixed-radius buffers per point without routing, clipped via Voronoi.
objectnat.get_radius_coverage(gdf_from, radius, resolution=32)
¶Calculate radius-based coverage zones using Voronoi polygons.
Parameters:
| Name | Type | Description | Default |
|---|---|---|---|
gdf_from
|
GeoDataFrame
|
Source points for which coverage zones are calculated. |
required |
radius
|
float
|
Maximum coverage radius in meters. |
required |
resolution
|
int
|
Number of segments used to approximate quarter-circle in buffer (default=32). |
32
|
Returns:
| Type | Description |
|---|---|
GeoDataFrame
|
GeoDataFrame with smoothed coverage zone polygons in the same CRS as original gdf_from. |
Notes
- Automatically converts to local UTM CRS for accurate distance measurements
- Final zones are slightly contracted then expanded for smoothing effect
Source code in src\objectnat\methods\coverage_zones\radius_voronoi_coverage.py
5 6 7 8 9 10 11 12 13 14 15 16 17 18 19 20 21 22 23 24 25 26 27 28 29 30 31 32 33 34 35 36 37 | |
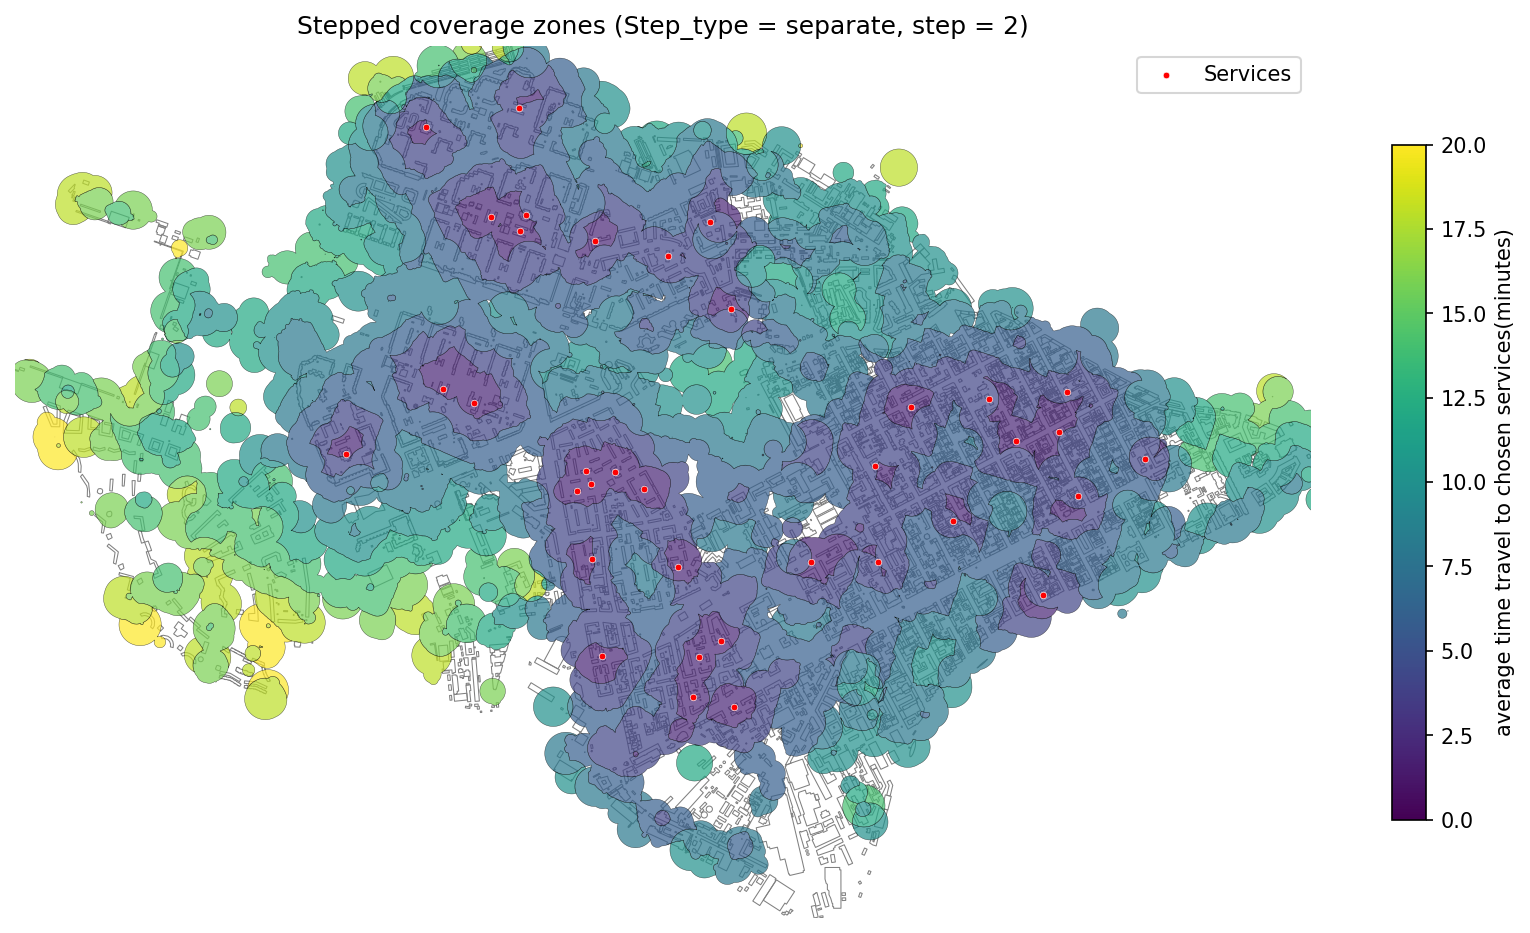
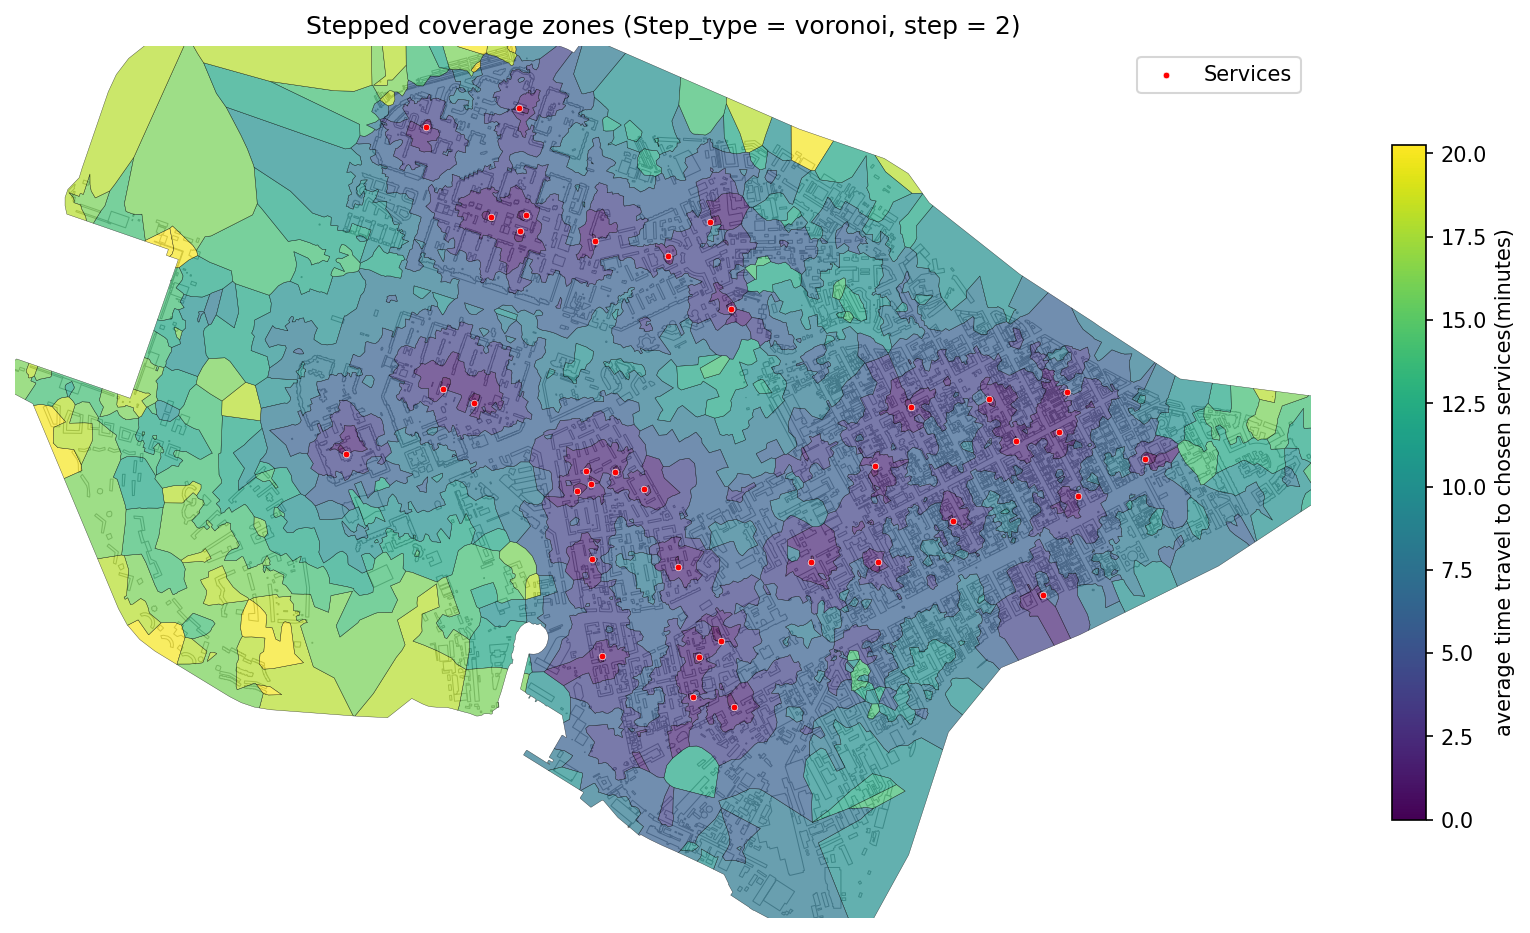
Stepped graph coverage
Creates stepped zones (e.g., 5, 10, 15 minutes) using the full transport graph per point.
objectnat.get_stepped_graph_coverage(gdf_to, nx_graph, weight_type, step_type, weight_value_cutoff=None, zone=None, step=None)
¶Calculate stepped coverage zones from source points through a graph network using Dijkstra's algorithm and Voronoi-based or buffer-based isochrone steps.
This function combines graph-based accessibility with stepped isochrone logic. It: 1. Finds nearest graph nodes for each input point 2. Computes reachability for increasing weights (e.g. time or distance) in defined steps 3. Generates Voronoi-based or separate buffer zones around network nodes 4. Aggregates zones into stepped coverage layers 5. Optionally clips results to a boundary zone
Parameters:
| Name | Type | Description | Default |
|---|---|---|---|
gdf_to
|
GeoDataFrame
|
Source points from which stepped coverage is calculated. |
required |
nx_graph
|
Graph
|
NetworkX graph representing the transportation network. |
required |
weight_type
|
Literal['time_min', 'length_meter']
|
Type of edge weight to use for path calculation: - "time_min": Edge travel time in minutes - "length_meter": Edge length in meters |
required |
step_type
|
Literal['voronoi', 'separate']
|
Method for generating stepped zones: - "voronoi": Stepped zones based on Voronoi polygons around graph nodes - "separate": Independent buffer zones per step |
required |
weight_value_cutoff
|
float
|
Maximum weight value (e.g., max travel time or distance) to limit the coverage extent. |
None
|
zone
|
GeoDataFrame
|
Optional boundary polygon to clip resulting stepped zones. If None, concave hull of reachable area is used. |
None
|
step
|
float
|
Step interval for coverage zone construction. Defaults to: - 100 meters for distance-based weight - 1 minute for time-based weight |
None
|
Returns:
| Type | Description |
|---|---|
GeoDataFrame
|
GeoDataFrame with polygons representing stepped coverage zones for each input point, annotated by step range. |
Notes
- Input graph must have a valid CRS defined.
- MultiGraph or MultiDiGraph inputs will be simplified to Graph/DiGraph.
- Designed for accessibility and spatial equity analyses over multimodal networks.
Source code in src\objectnat\methods\coverage_zones\stepped_coverage.py
14 15 16 17 18 19 20 21 22 23 24 25 26 27 28 29 30 31 32 33 34 35 36 37 38 39 40 41 42 43 44 45 46 47 48 49 50 51 52 53 54 55 56 57 58 59 60 61 62 63 64 65 66 67 68 69 70 71 72 73 74 75 76 77 78 79 80 81 82 83 84 85 86 87 88 89 90 91 92 93 94 95 96 97 98 99 100 101 102 103 104 105 106 107 108 109 110 111 112 113 114 115 116 117 118 119 120 121 122 123 124 125 126 | |